 The NPX Design Review (NDR) has a 30 minute “Hands-on Exercise” where the NDR Examiners present an issue with a live system that you need to resolve. This post is an enhancement of the troubleshooting strategy I developed for VCDX and tailored for NPX and Nutanix XCP troubleshooting.
The NDR Examiners are the only ones with access to the live environment, so you need to talk them through what interfaces and screens to access. They are playing the role of a “customer”, with minimal training and knowledge of the platform, and the NPX candidate is the “expert” driving the resolution.
This post is written with an ESXi and AHV focus, Hyper-V is not covered at all.
The NPX Link-O-Rama is a great resource for all things NPX, including this applicable list of articles in my VCDX Deep-Dive series (more than 70 posts).
Some initial pointers:
- Segment the whiteboard into a template (Q&A, Compute, Network, Storage, VM, VIM, Backup/Recovery, BC/DR, Security).
- You are not being graded for fixing the issue, you are being marked on your troubleshooting methodology.
- You need to demonstrate a systematic and reasoned approach to problem resolution.
- Do not skip from silo to silo, start in the area where you suspect the issue lies, complete the “top-down” or “bottom-up” process and then move to the next silo.
- Do not expect to complete every silo. The strategy below MAY allow you to complete four silos.
- 30 minutes is a very short amount of time, so move quickly and methodically through your process.
- The Examiners want you to succeed, listen carefully to their responses for clues and hints.
- If you encounter any “architecture design” flaws, explain the problem and how you would resolve it from a design perspective.
- React to their answers if something does not make sense.
- Each scenario has additional hidden bonus points; the Examiners are following a script where you need to ferret out the information by asking the correct questions.
- Reason out loud, you cannot be graded on your thought process if you are silent.
- Be mindful of the 30 minute timer, stick to your strategy and be wary of the “Rabbit Hole” – do not get stuck in one section, spinning your wheels, asking questions that do not advance and improve your position. Practice standing whilst presenting with the NPX timer running on a tablet.
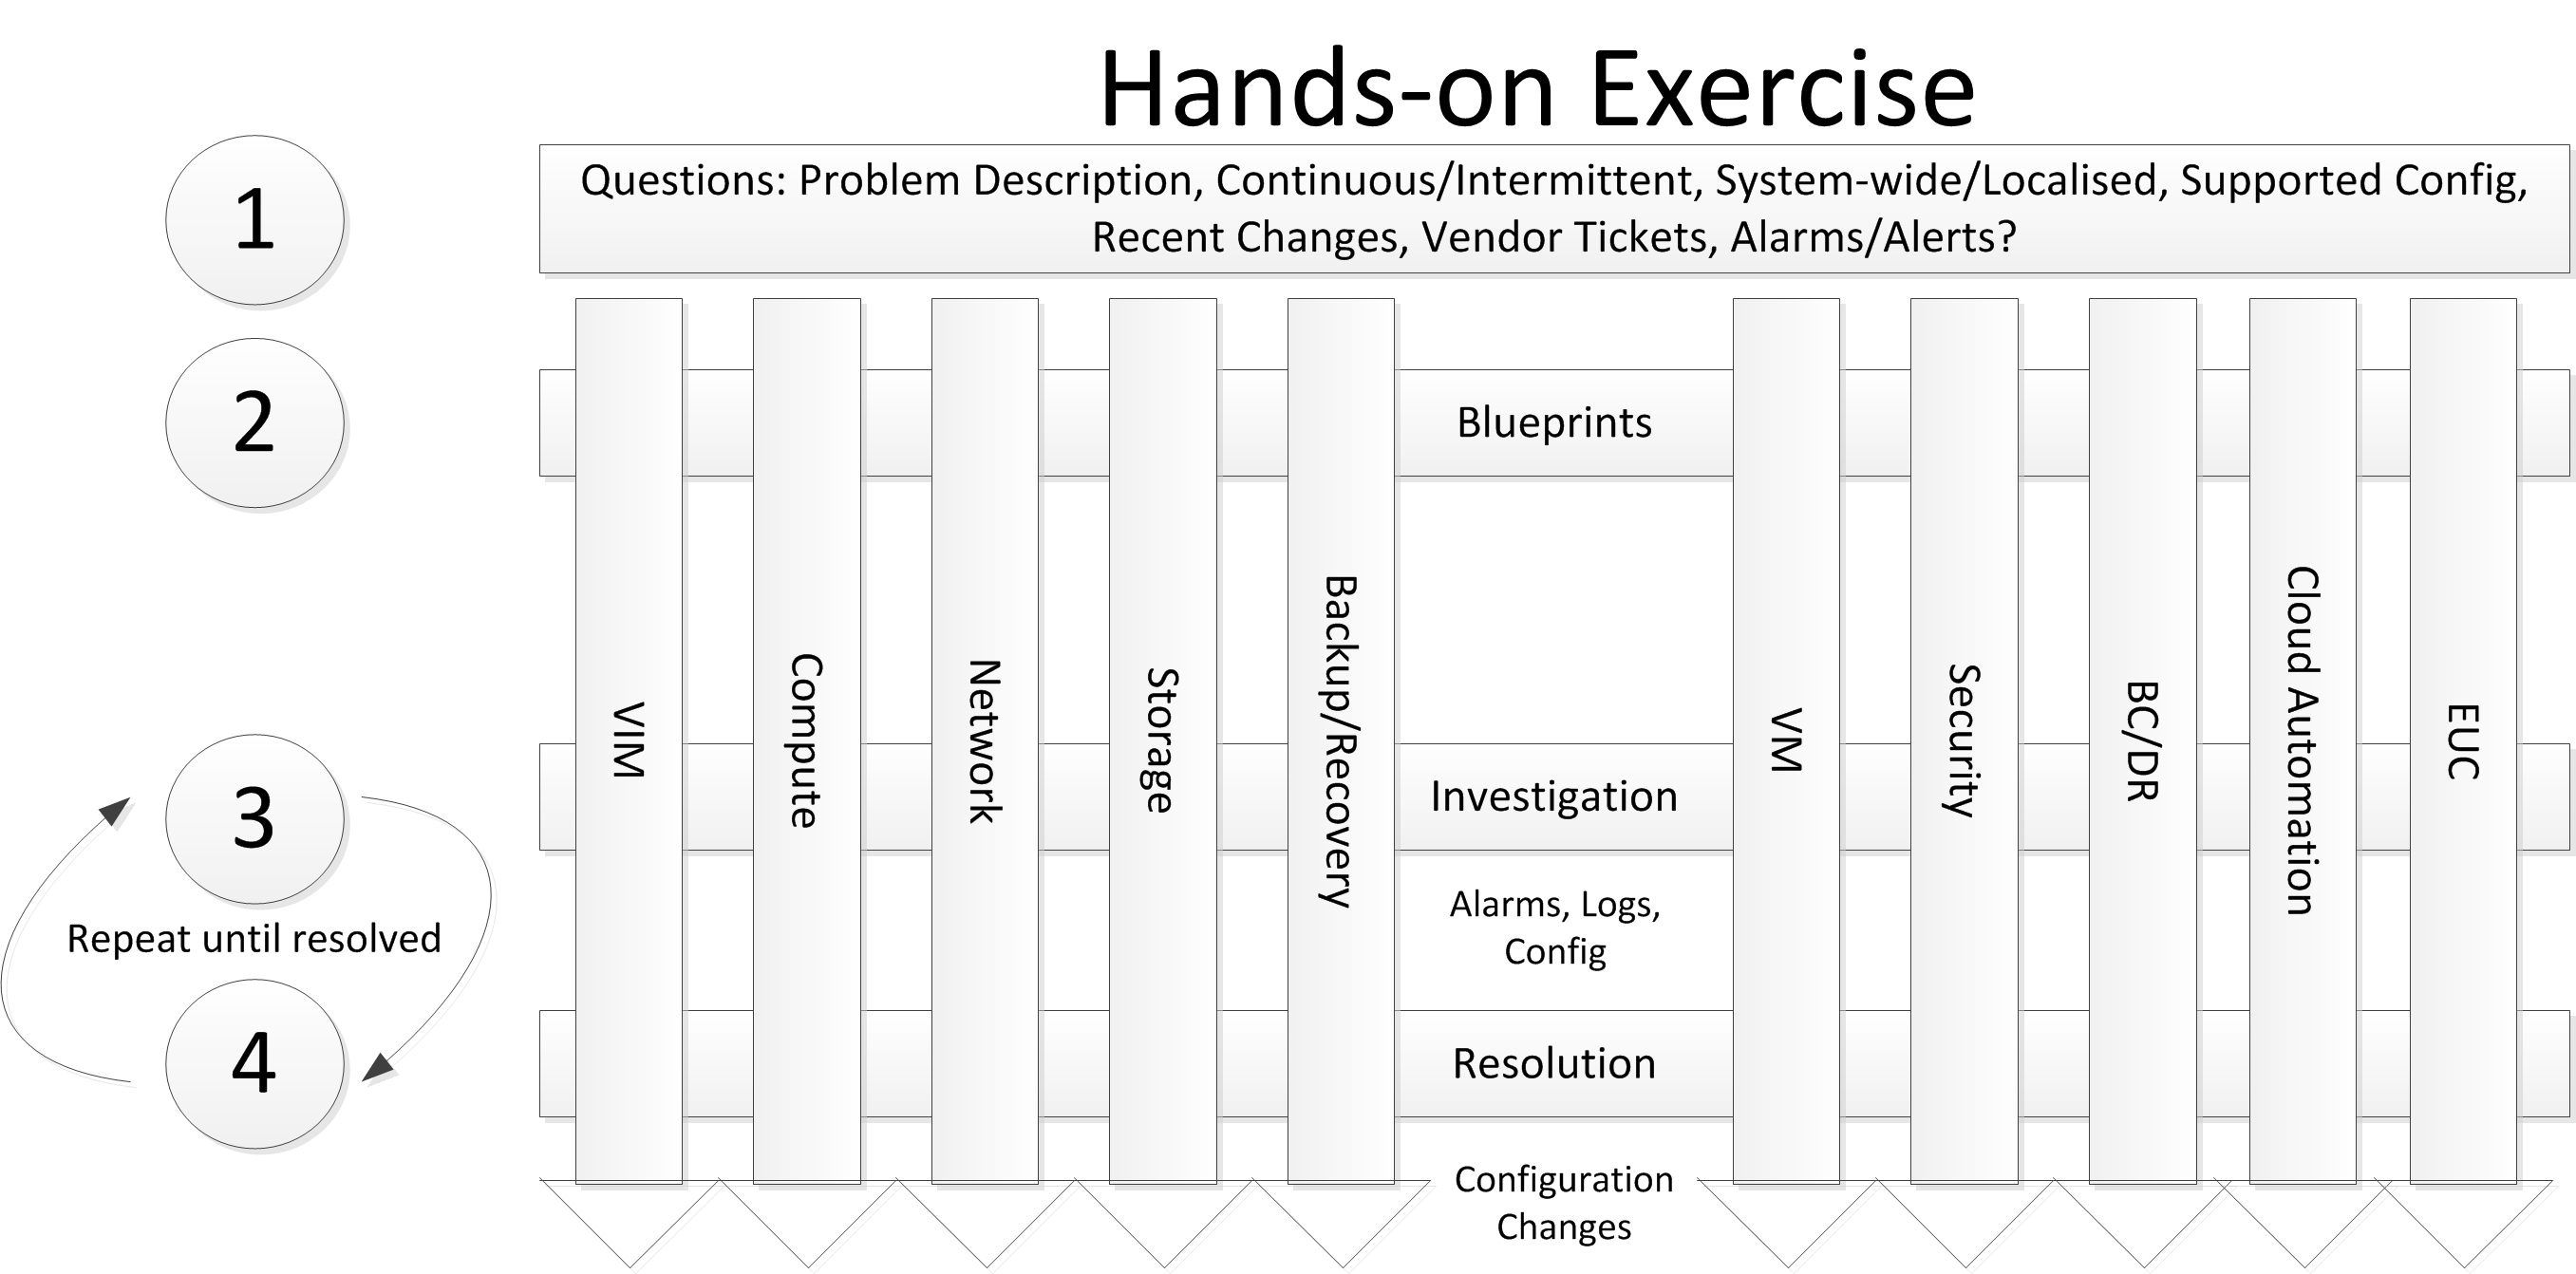
Questions to Consider (5min)
- What is the Problem Description?
- What is the Criticality of the system?
- Has a Service Request been opened with the relevant Vendor(s)?
- Is the issue Continuous or Intermittent?
- Is the issue System-wide or Localised?
- Is the solution officially supported by Nutanix and the hypervisor vendor?
- Have there been any Recent Changes?
- What are the reported Alarms and Alerts?
- What Hypervisor is being used within this Nutanix solution? Which version?
- Which Nutanix appliance family is being used (Nutanix XCP, Dell XC or Lenovo)? Which version? Are the Inter-Mix rules being followed?
Solution Blueprint (basic block diagrams – 5min)
- Extract the Compute & Availability Blueprint from the Examiners.
- Extract the Storage Blueprint from the Examiners.
- Extract the Network Blueprint from the Examiners.
- Extract the Virtual Infrastructure Management (VIM) Blueprint from the Examiners.
- Extract the Data Protection (BC/DR & Backup/Recovery) Blueprint from the Examiners.
- If you think the other silos are involved, explore them as well: Virtual Machine (VM), Security, Cloud Management and EUC.
Based upon the answers to the initial questions and sketching the initial solution blueprint, you will have to pick the most likely silo where you think the problem(s) lie.
It is also worth being able to describe the vSphere stack (if applicable, otherwise AHV or Hyper-V) as described in this blog post; in particular being able to draw it on a whiteboard very quickly and use it for the silos below.
Compute, Performance & Availability (5min)
- Investigate (ESXi): VM -> Scheduler/Malloc, vSphere HA, vSphere DRS, Resource Pools, Reservations, Limits.
- Investigate (AHV): VM -> Scheduler/Malloc, VM-HA.
- Resolve: If you find settings that could be misconfigured, suggest a change, explain why and continue to move through the stack.
- Once you have finished the Compute, Performance & Availability stack analysis, select the next silo and move on.
Storage (5min)
- Investigate (ESXi): VM -> VMM/Acropolis Vol. API -> NFS/iSCSI -> Datastores -> CVM -> Containers/Volume Groups/vDisks -> SCSI HBA (DAS) -> SSD/HDD, Active Working Set.
- Investigate (AHV): VM -> iSCSI Initiator/Acropolis Vol. API -> AHV iSCSI Redirector -> CVM -> Volume Groups -> vDisks -> SCSI HBA (DAS) -> SSD/HDD, Active Working Set.
- Investigate (CVM): Controller VM sizing.
- Resolve: If you find settings that could be misconfigured, suggest a change, explain why and continue to move through the stack.
- Once you have finished the Storage stack analysis, select the next silo and move on.
Network (5min)
- Investigate (ESXi): VM -> VMM -> vSwitch -> NIOC -> vmnic -> Access SW -> Core SW -> Router/Firewall (Legacy Switch Topology).
- Investigate (AHV): VM -> QEMU -> Tap -> Bridge (IPAM/VXLAN/OpenFlow/Acropolis Master) -> Bond -> Uplink -> Leaf SW -> Spine SW -> Border Leaf SW -> Router/Firewall (Leaf/Spine Topology).
- Resolve: If you find settings that could be misconfigured, suggest a change, explain why and continue to move through the stack.
- Once you have finished the Network stack analysis, select the next silo and move on.
Virtual Infrastructure Management (5min)
- Investigate (ESXi): vSphere Client/Browser -> Web Client/vCenter -> Inventory Service -> SSO Service -> Database.
- Investigate (AHV): Prism Central, Acropolis Master, LDAP Integration.
- Resolve: If you find settings that could be misconfigured, suggest a change, explain why and continue to move through the stack.
- Once you have finished the Virtual Infrastructure Management stack analysis, select the next silo and move on.
Data Protection (5min)
- Investigate (ESXi): Async DR/Metro/Cloud Connect -> Protection Domain -> Configuration Group -> Remote Sites -> Inter-Site Connectivity.
- Investigate (AHV): Async DR/Cloud Connect -> Protection Domain -> Configuration Group -> Remote Sites -> Inter-Site Connectivity.
- Resolve: If you find settings that could be misconfigured, suggest a change, explain why and continue to move through the stack.
- Once you have finished the Data Protection analysis, select the next silo and move on.
Common Resolution & Test methods to Consider – General
If you request information/tests/tool output, make sure you can explain how to access and use them and then interpret and explain the information returned.
- Change one thing at a time, test, leave/rollback, then propose the next step.
- Move the “problem VM” to another Host/Datastore/vSwitch.
- Console access to “problem VM”: access application, storage, iometer, copy files, network, ping –t gateway, check event logs.
Nutanix XCP
- Prism Central/Prism Element UI: Home, Health, Hardware, VM, Storage, Data Protection, Analysis, Alerts and Configuration Settings pages.
- SSH to CVM.
- Nutanix Cluster Status: ncli cluster status.
- Nutanix Cluster logs: /home/nutanix/data/logs, ls for *.ERROR, *.FATAL files.
- Nutanix Cluster Configuration: NTP, DNS, Cluster Name, Cluster External IP, Redundancy Factor, Availability Domains.
- Nutanix Container Configuration: Replication Factor, Performance-tier/Capacity-tier Deduplication, Inline/Post Compression, Erasure Coding, Mounted Hosts, Whitelist.
- Nutanix Cluster Check: ncc health_checks run_all.
- Only execute on a Non-Production Cluster – Nutanix Diagnostics: diagnostics.py – -display_latency_stats – -run_iperf run.
- CVM Detailed UI Interface: http:// <CVM IP>:<port>, where port = 2009 (Stargate), 2010 (Curator), 2011 (Chronos), 2016 (Pithos), 2020 (Cerebro), 2030 (Acropolis – make sure iptables is modified to allow access from outside network).
- Other interfaces: PowerShell Commandlets, REST API, nCLI client, IPMI, BIOS, Node Console/KVM.
Nutanix AHV
- SSH access to CVM and AHV.
- CVM: top, ps, allssh, manage_ovs (show_interfaces, update_links), acli (net, ha, vm, host, vg), change_cvm_vlan, cvm_shutdown (-P now).
- AHV: top, ps, virsh (list – -all, shutdown, start), ovs-vsctl (show, setport, add-br, add-bond, add-port), ovs-appctl (bond/show), ip link, ifconfig, iscsi_redirector, huge pages enabled, shutdown (-h now).
VMware vSphere
- SSH access to ESXi host: vmkping neighbour hosts/iSCSI/NAS/vmk, esxtop analysis.
- Check alarms and event logs of vCenter, reports of vROps (if used).
vSphere Host Logs
- /var/log/vmkwarning.log – Summary of Warnings and Alerts.
- /var/log/vmksummary.log – Summary of Startup, Shutdown, Uptime, #VMs, consumption.
- /var/log/vmkernel.log – Core Vmkernel logs.
- /var/log/vpx.log – vCenter agent logs.
- /var/log/fdm.log – vSphere HA logs.
- /VM Folder/vmware.log – VM logs.
vSphere vCenter Logs
- Location: %ALLUSERSPROFILE%\Application Data\VMware\VMware VirtualCenter\Logs\
- Vpxd.log – Main vCenter server logs.
- Vpxd-profiler.log, profiler.log, scoreboard.log – Profiled metrics for operations performed in vCenter.
- Cim-diag.log, vws.log – Common Information Model monitoring information.
- Drmdump\ – Actions by DRS.
esxtop
- CPU:%RDY:10: Overprovisioning of vCPUs, excessive usage of vSMP or a limit(check %MLMTD) has been set.
- CPU:%CSTP:3: Excessive usage of vSMP. Decrease vCPUs for this VM.
- CPU:%SYS:20: System services for world.
- CPU:%MLMTD:0: Percentage of time vCPU was ready to run but could not due to CPU Limit settings.
- CPU:%SWPWT:5: VM waiting on swapped pages to be read from disk.
- MEM:MCTLSZ:1: Host is forcing VMs to inflate balloon driver.
- MEM:SWCUR:1: Swapped memory pages in past.
- MEM:SWR/s:1: Host actively reading from swap.
- MEM:SWW/s:1: Host actively writing to swap.
- MEM:CACHEUSD:1: Host has compressed memory.
- MEM:ZIP/S:>0: Host is actively compressing memory.
- MEM:UNZIP/S:>0: Host is actively accessing compressed memory.
- MEM:N%L:<80: VM experiences poor NUMA locality.
- NETWORK:%DRPTX/RX:1: Dropped packets received or transmitted, hardware overworked.
- DISK:DAVG:25: Disk latency caused by array.
- DISK:KAVG:2: Disk latency caused by kernel.
- DISK:QUED:1: Queue maxed out.
- DISK:ABRTS/s:1: Aborts issued by VM because storage not responding.
- DISK:RESETS/s:1: Number of commands reset per second.
- DISK:CONS/s:20: Reservation Conflicts occurring (lock on VMFS).
Additional Resources:
- VCDX – Troubleshooting Scenario Strategy
- Josh Odgers VCDX Defence Essentials – Part 3- Preparing for the Troubleshooting Scenario
- Wahl Network – Using Sphere Elimination for Troubleshooting
- Kepner-Tregoe Method of Root Cause Analysis

simple and nice i Will bookmark this article.