 This is the VMware NSX for vSphere Troubleshooting Deep Dive. I have aggregated all of the troubleshooting commands, diagrams and explanations that I could find into this post. Brevity and bullet-points are used to keep the information concise and readable. If you want more information on a concept use the Additional Resources section at the end.
You do not have access to an NSX-v lab environment and you want to practice these commands? Use HOL-SDC-1425 – VMware NSX Advanced.
This post will be updated with additional information as part of the NSX Link-O-Rama. If you have content to contribute, post a comment below.
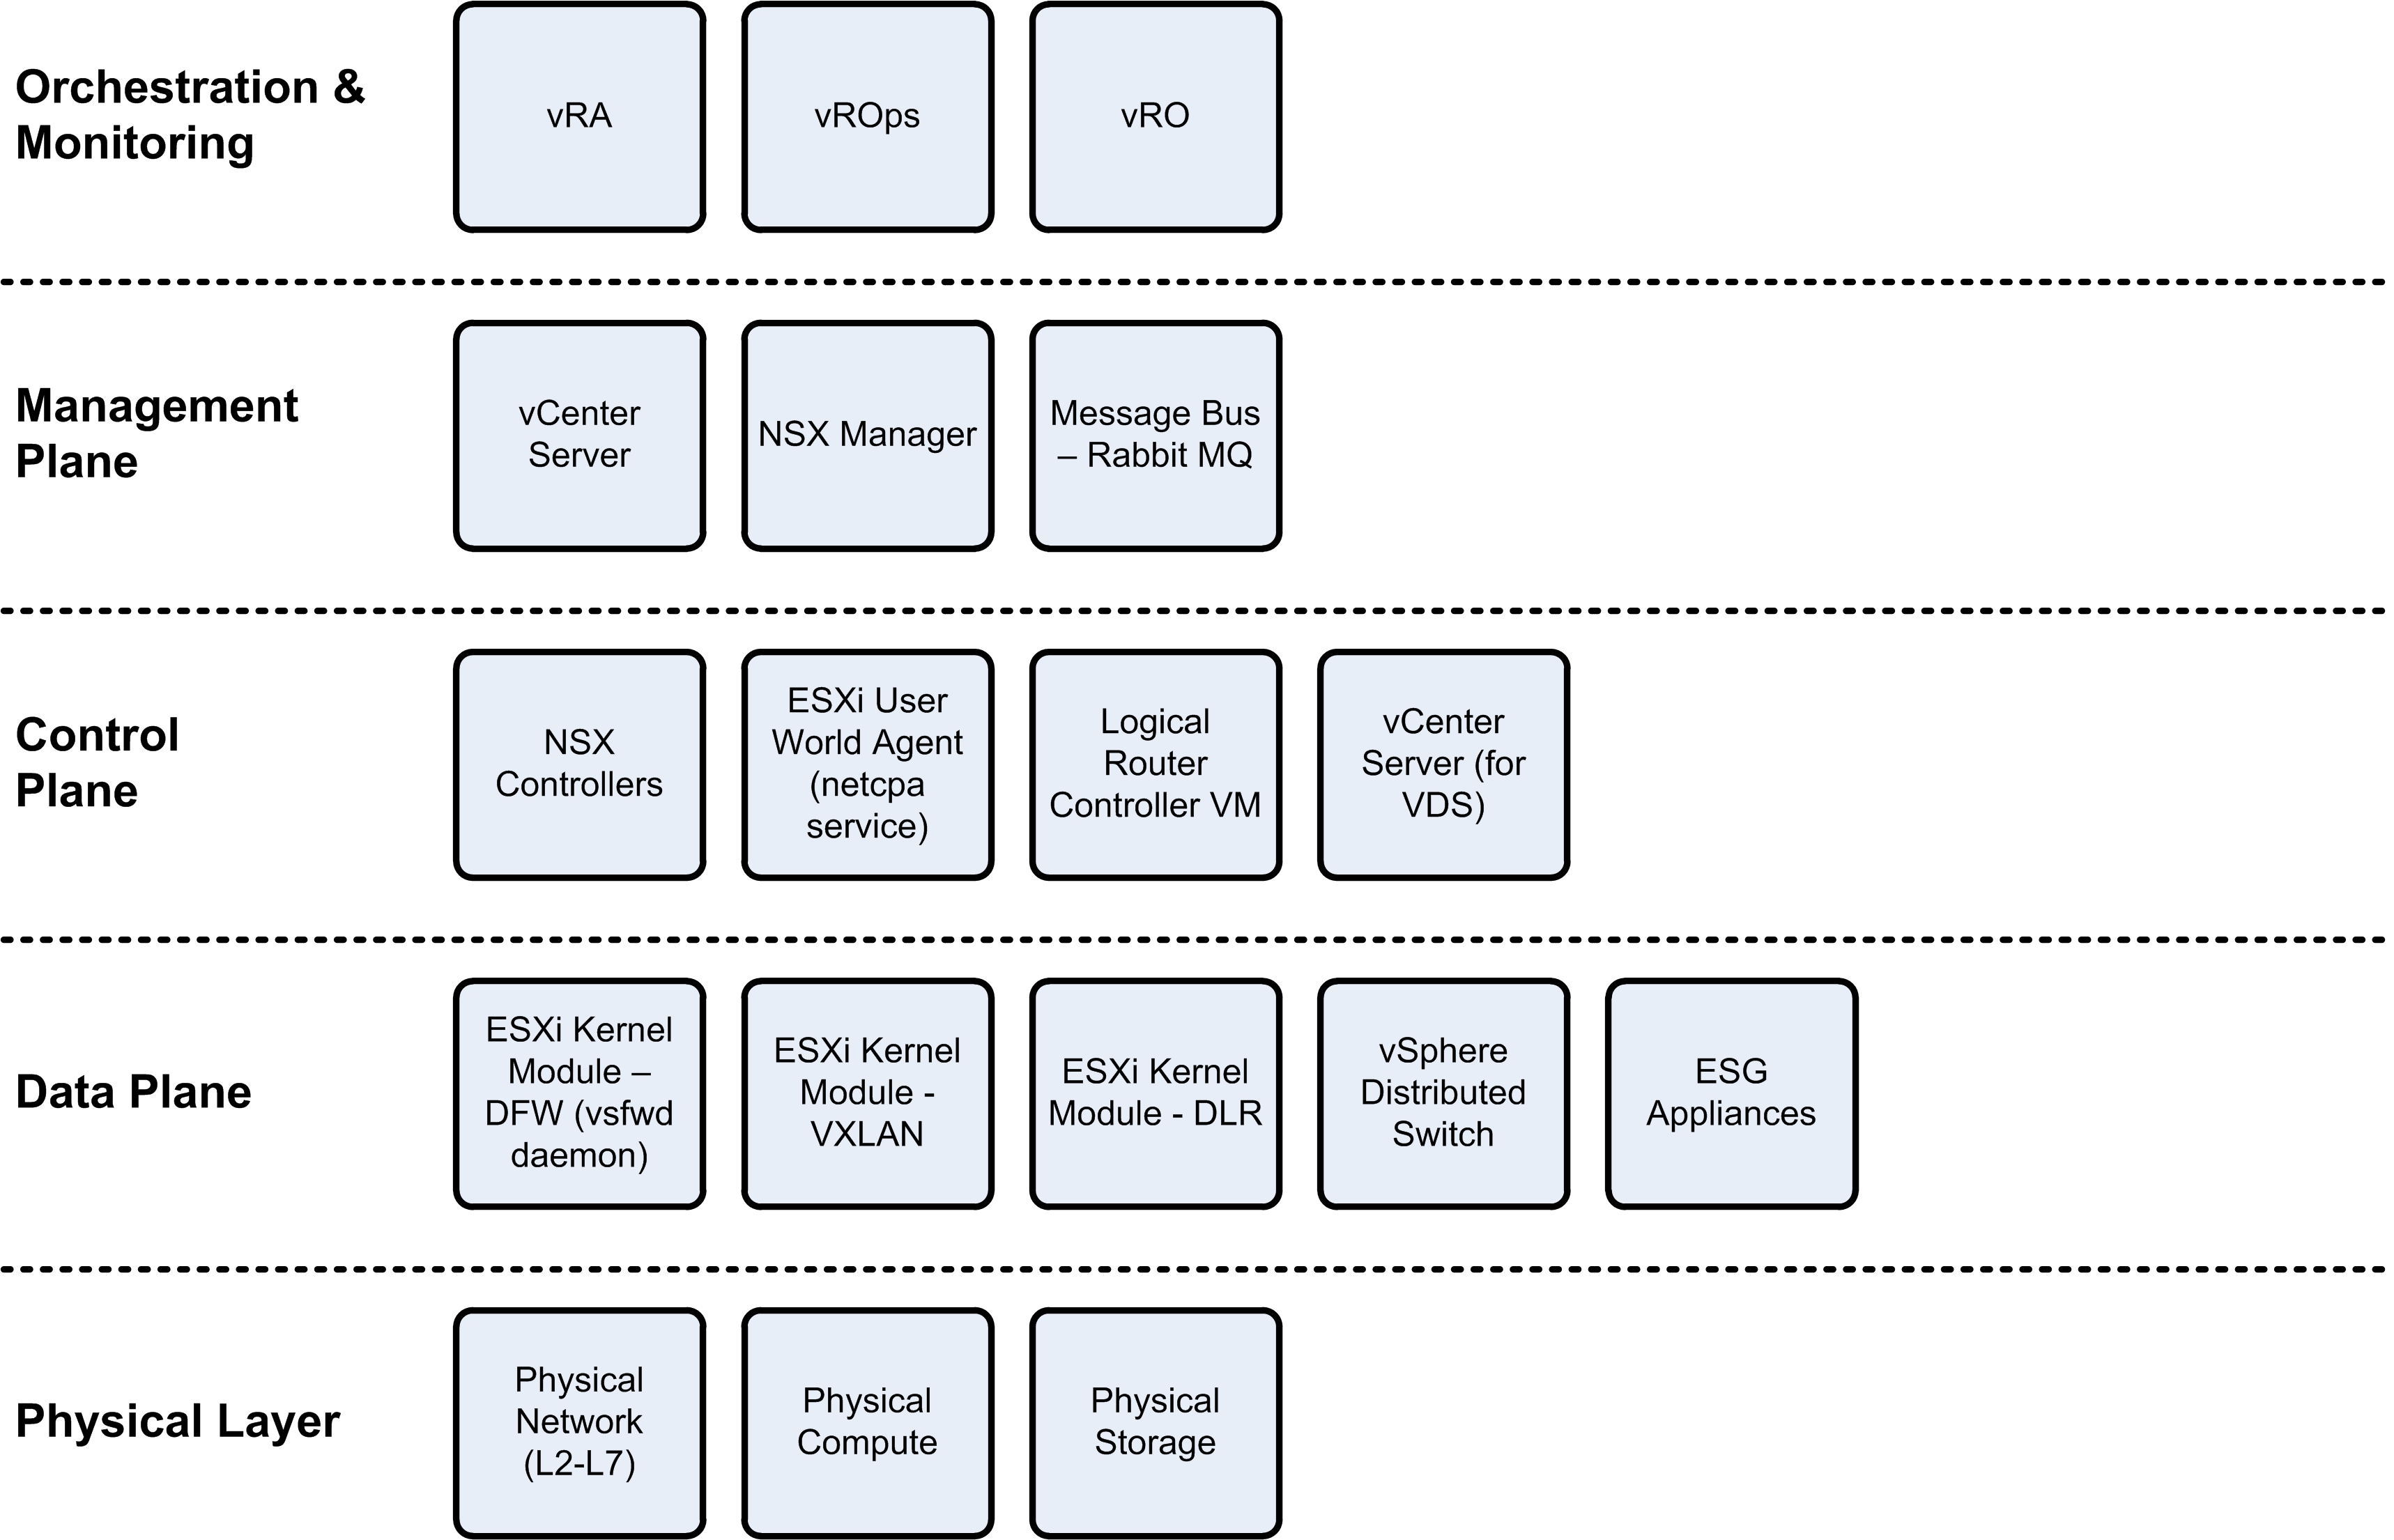
NSX-v Component Overview
This is a high level component view of NSX for vSphere. For a detailed diagram of vSphere ESXi, Tech101 – VMware vSphere ESXi.
Distributed Firewall Components – UPDATED!
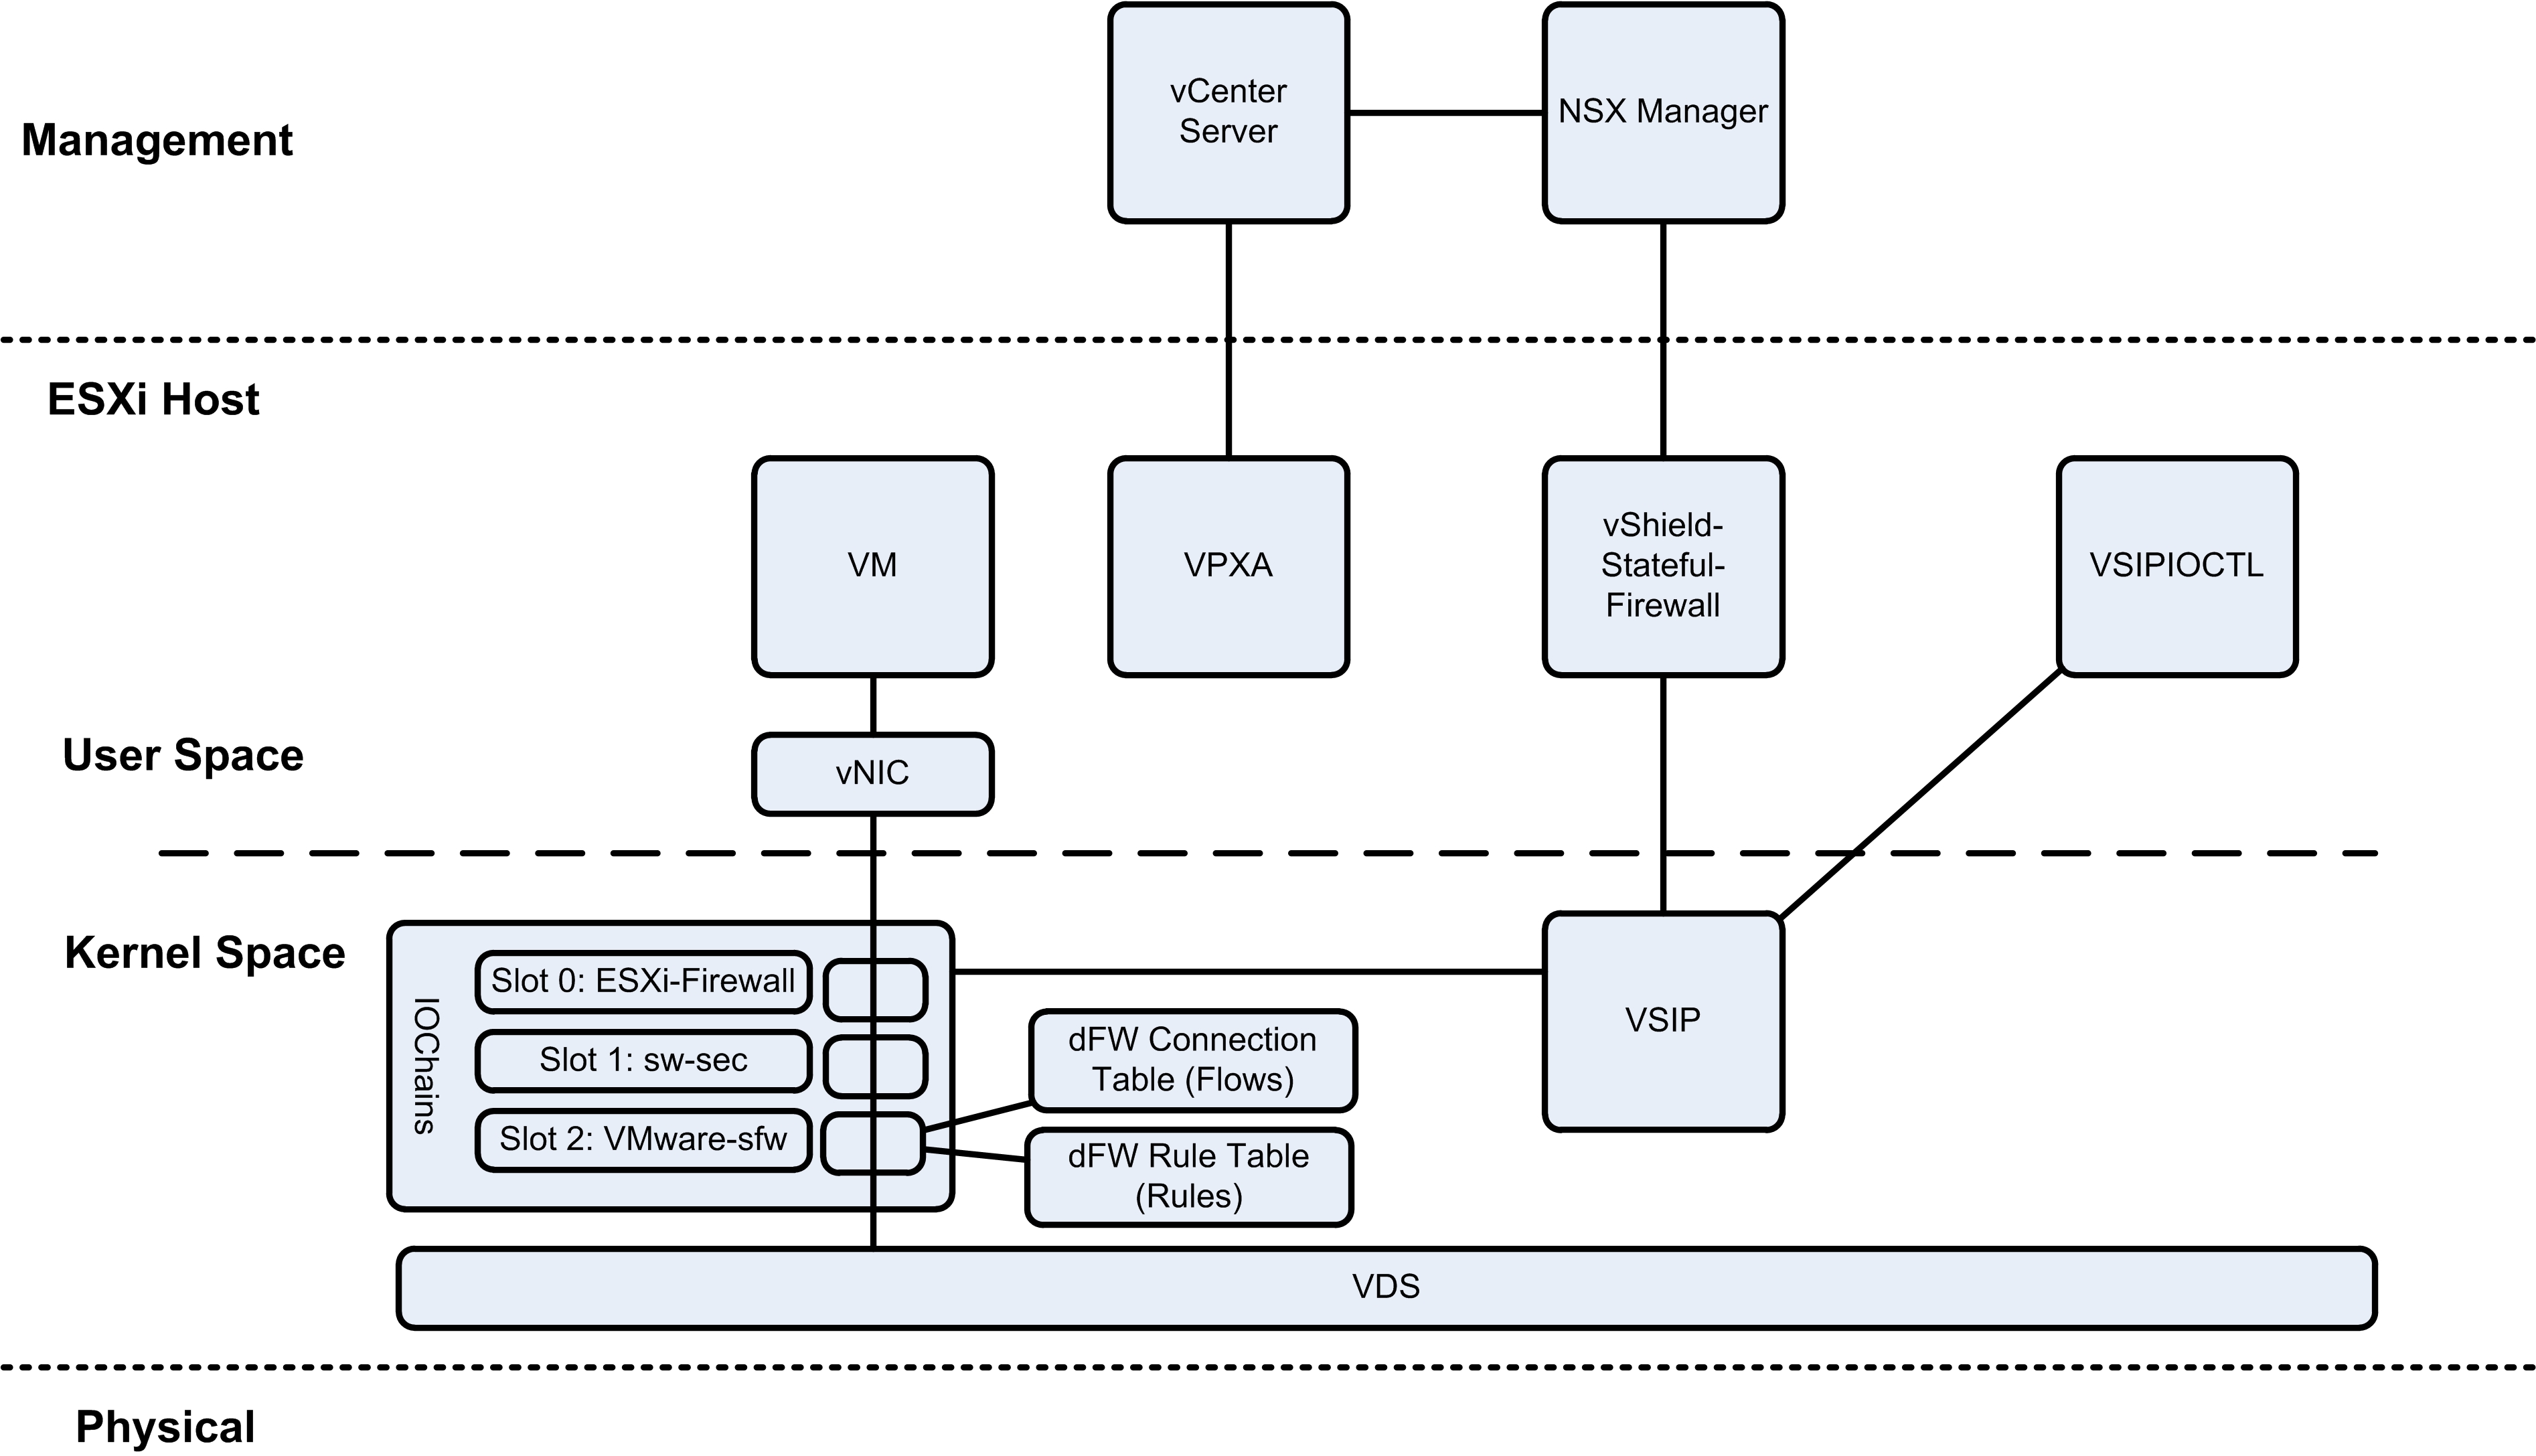
- VSIP: VMware Internetworking Service Insertion Platform
- VSIPIOCTL: VSIP I/O Control
- VPXA: vCenter Server agent
- IOChains: kernel-level packet handling process
- ESXi-Firewall: Distributed Virtual Filter (DVFilter)
- sw-sec: Switch Security
- VMware-sfw: Firewall rule storage and enforcement
DLR & ESG Components (2-Tier example)
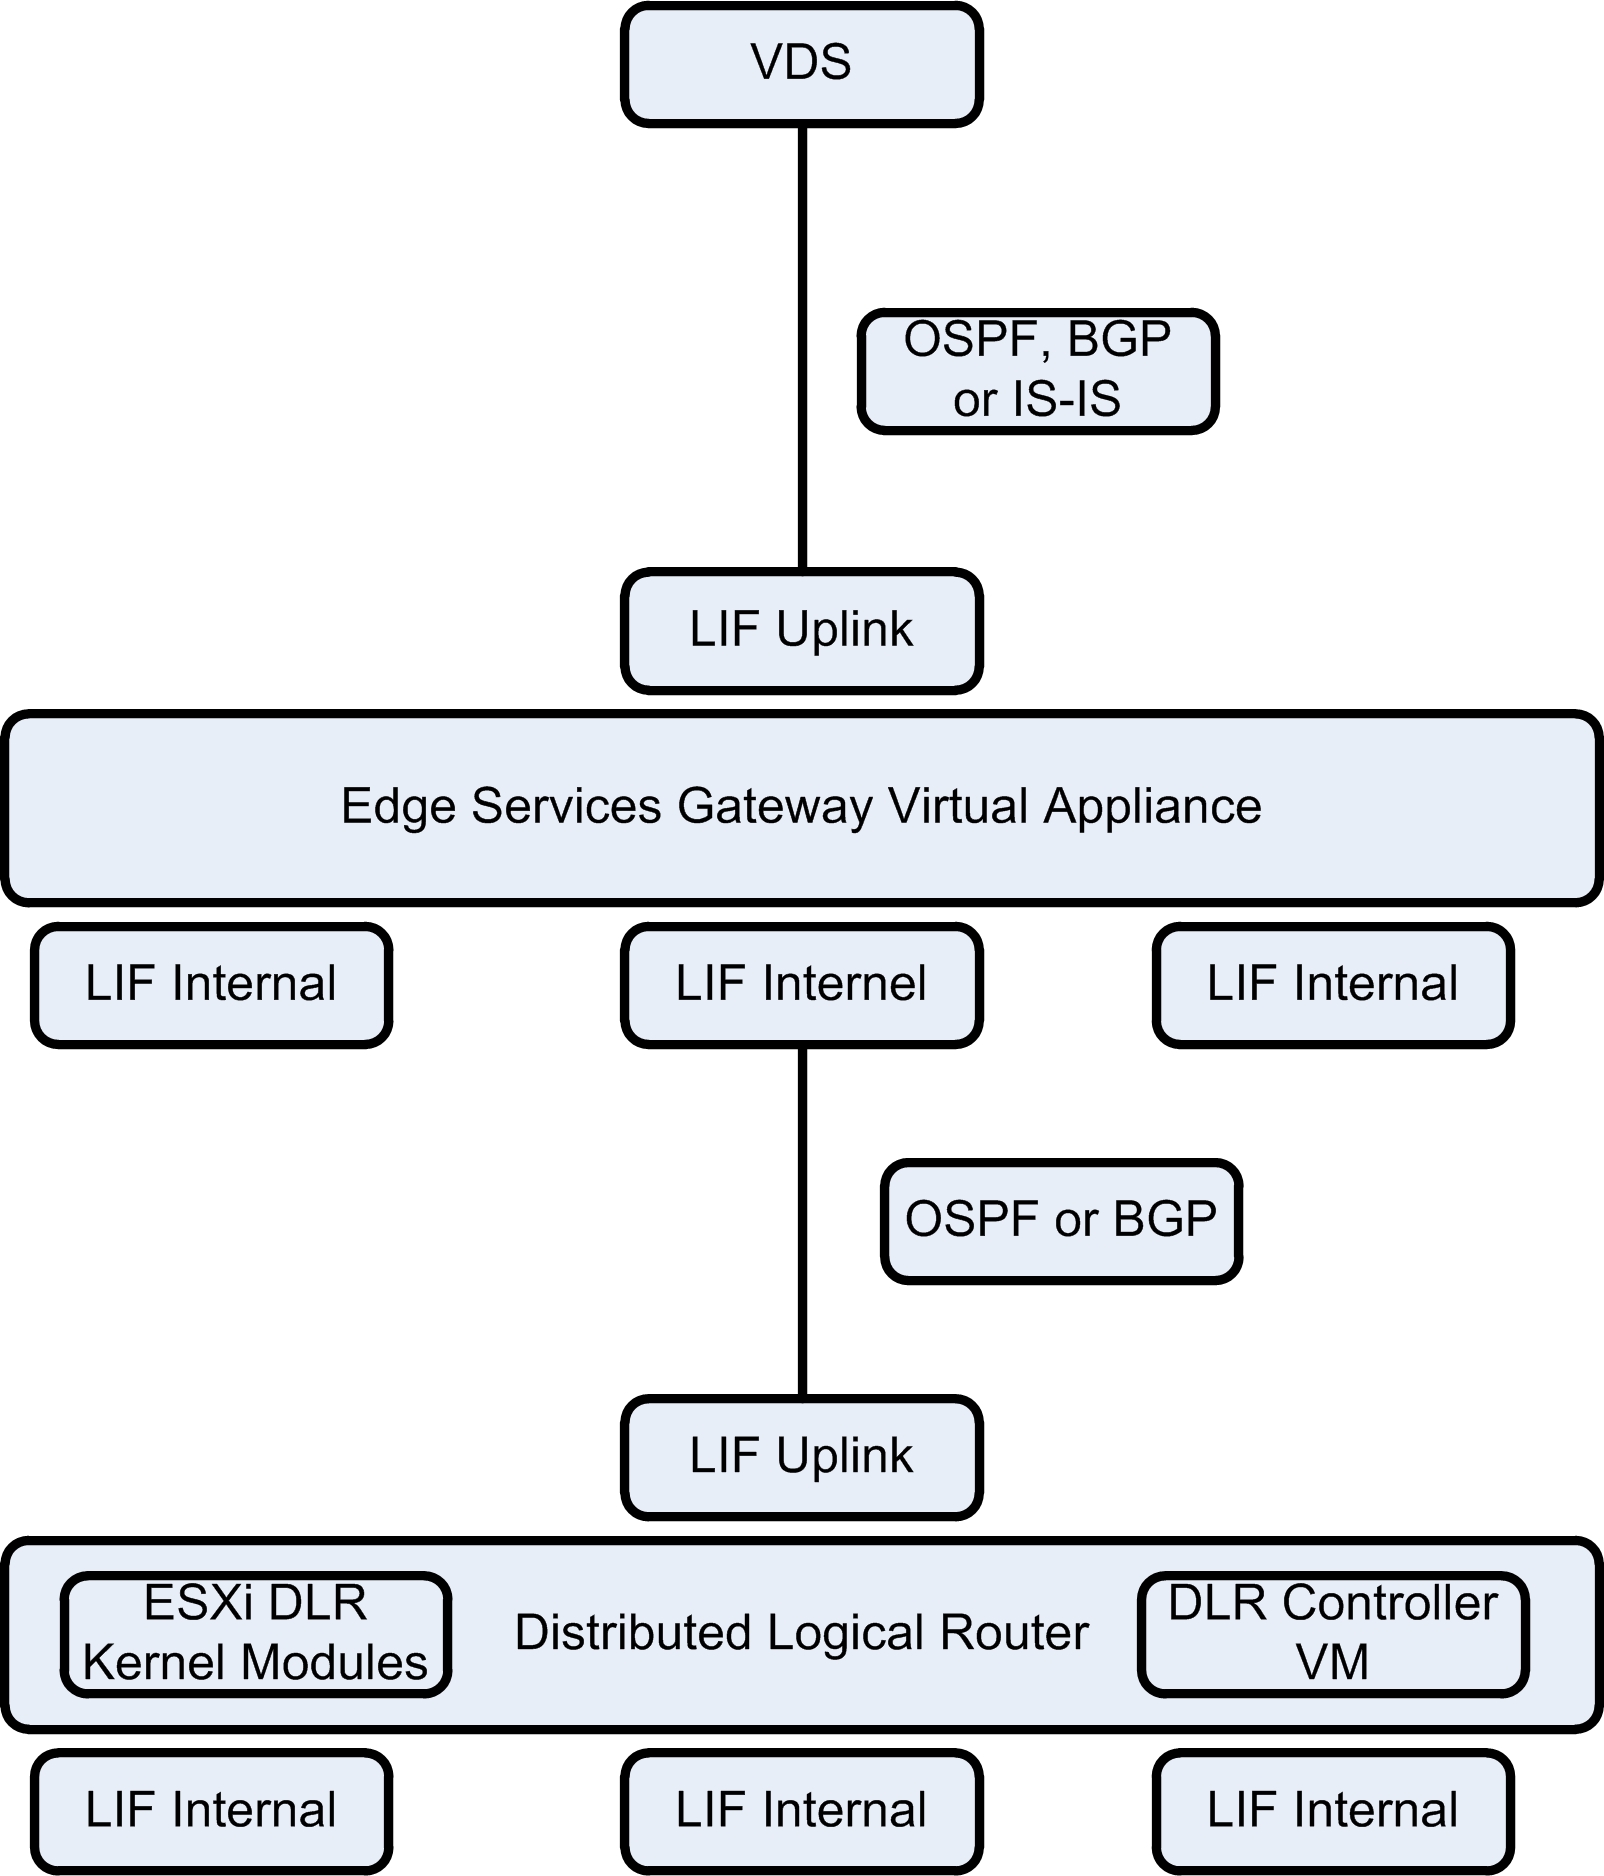
- LIF: Logical Interface
VXLAN Components
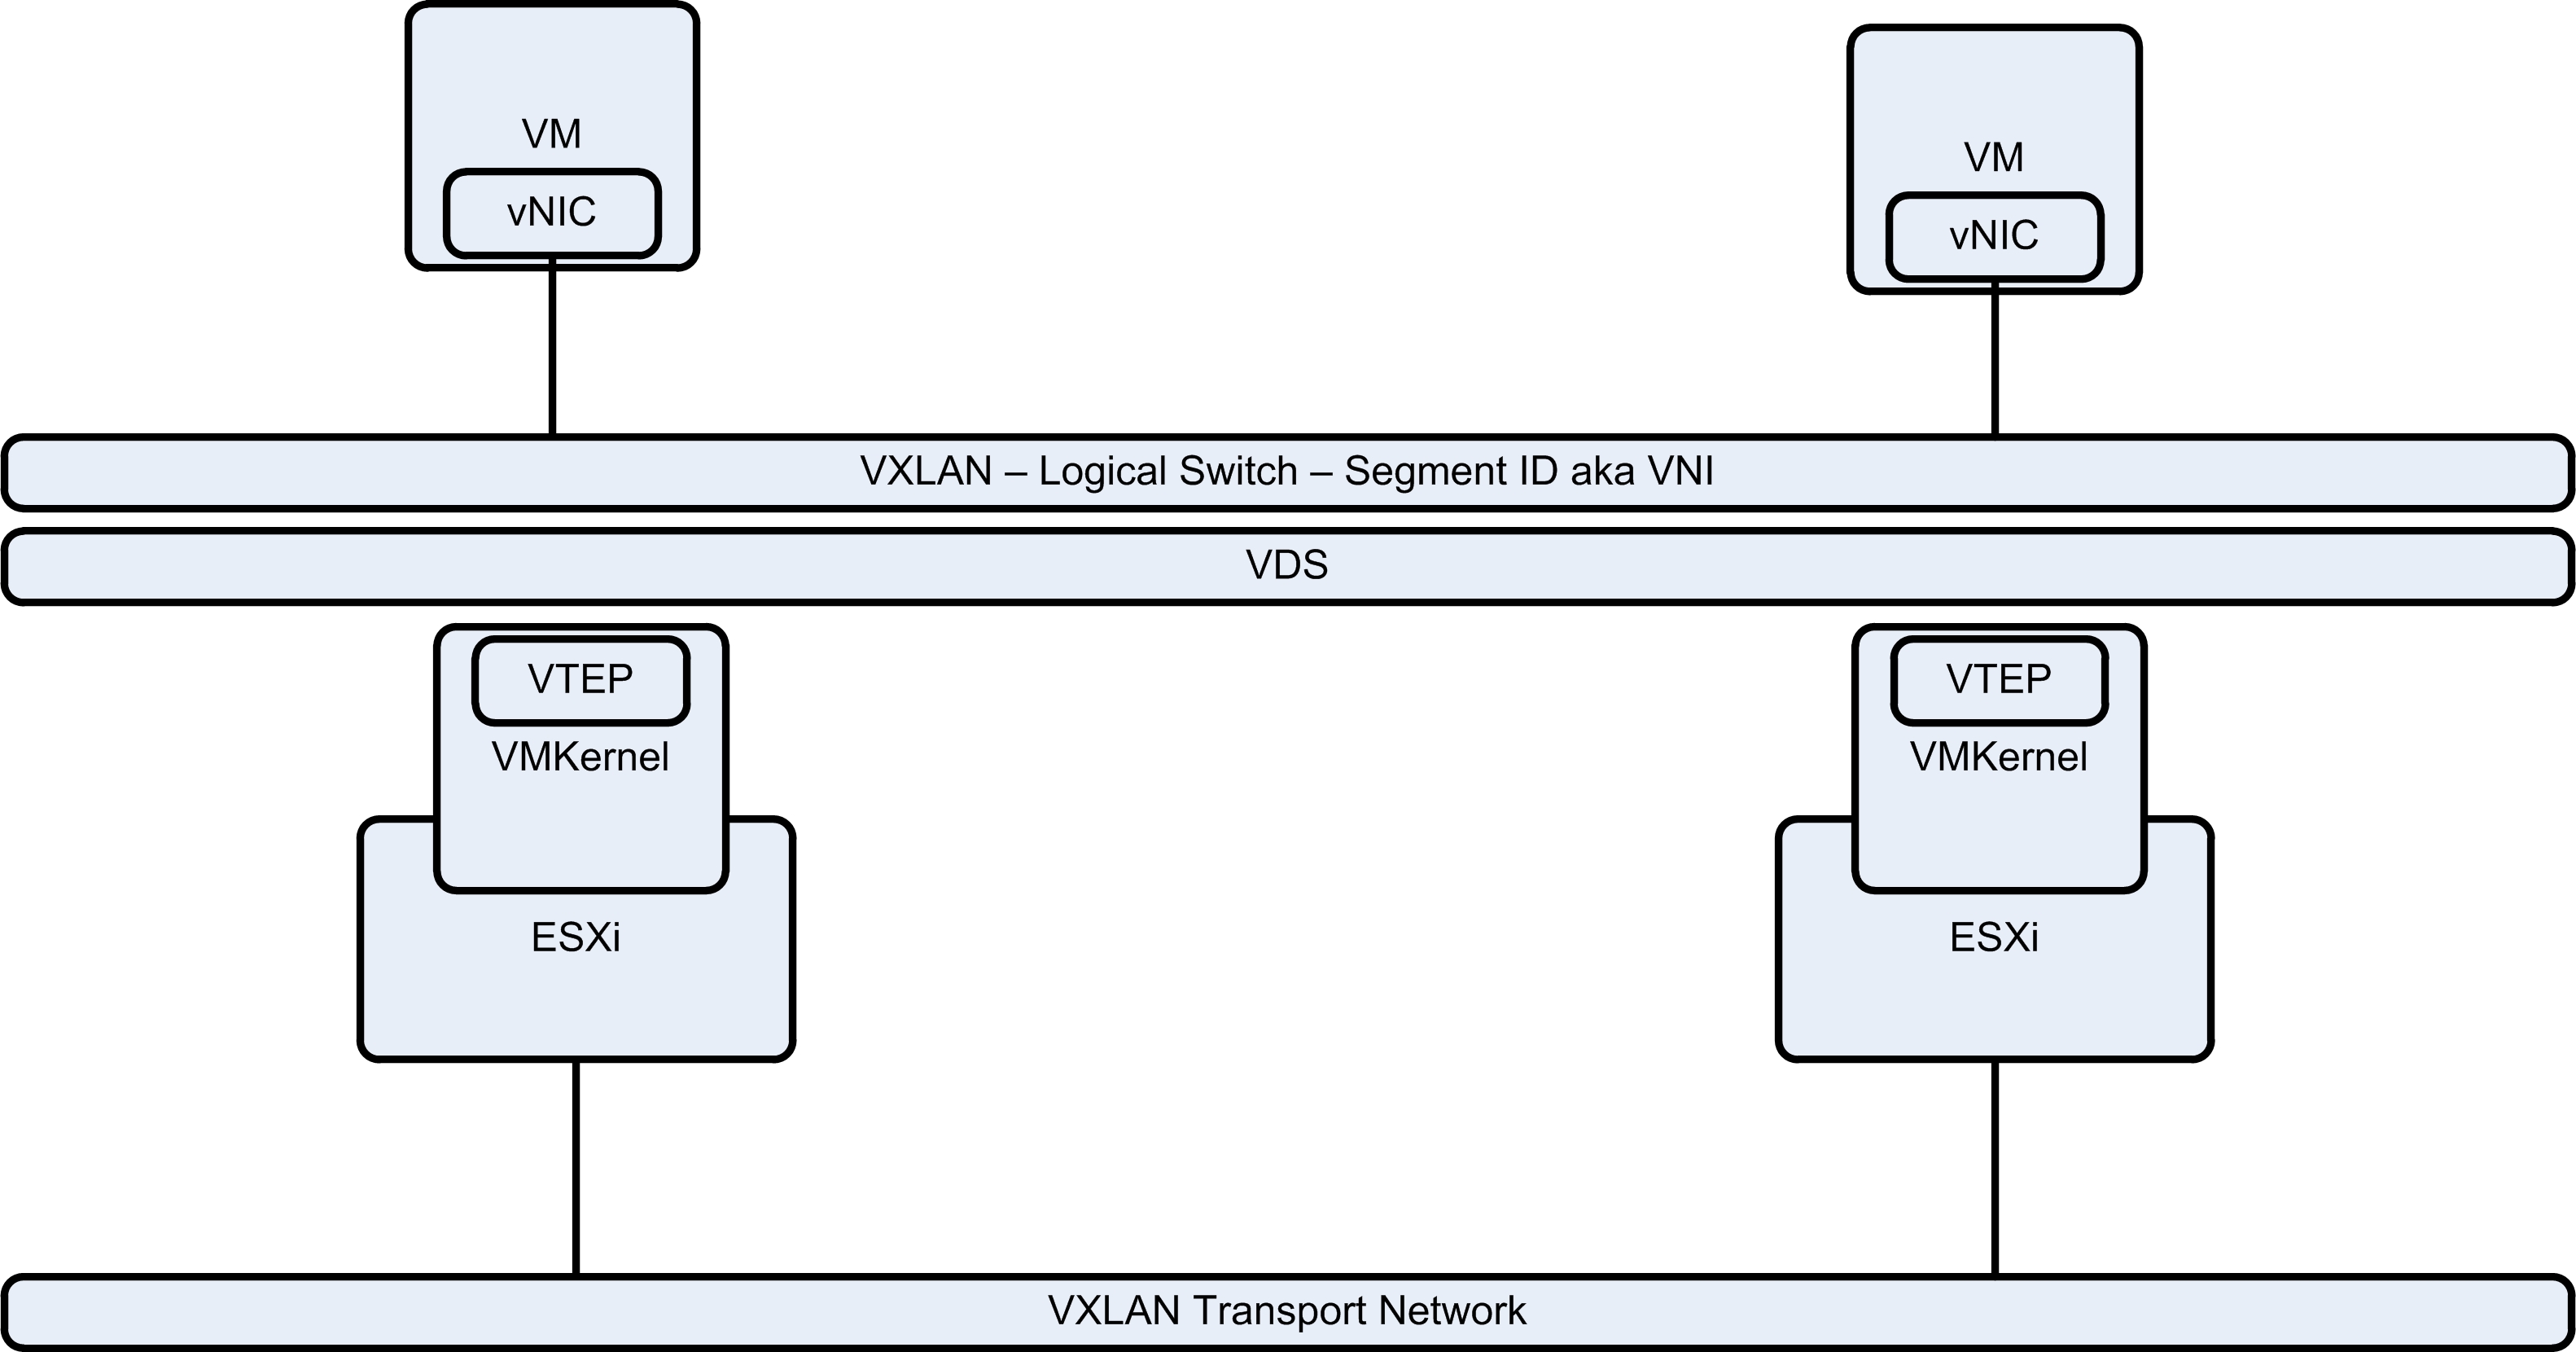
- VTEP: VXLAN Tunnel End Point encapsulated in VMkernel
- VNI: Virtual Network Identifier
Prerequisites and Assumptions
- You have an advanced understanding of NSX-v and vSphere
- You have administrator access to NSX-v and vSphere
- Diagram of your environment – get an A3 piece of paper and draw it (physical and virtual)
- Find the NSX-v component IP addresses via the vSphere Web Client and NSX Manager Plugin
- Make sure SSH is enabled on each vSphere and NSX component
- Use Putty to SSH to NSX Manager, NSX Controllers, ESGs, DLR Controller VMs and ESXi hosts
- All of these commands have been verified in NSX-v version 6.1.1
- Do not use a live production environment for experimentation, use HOL-SDC-1425 – VMware NSX Advanced instead
Controls
- Use the <TAB> key to auto-complete commands
- Use ? <ENTER> or -h <ENTER> for help
- Press <ENTER> or <TAB> twice at the end of a partially completed command to get an option list
Privileged Mode for NSX Manager and ESG/DLR Control VM
- Enter privileged mode: enable, enter password (prompt with change from > to #)
- Exit privileged mode: disable (prompt will change from # to >)
NSX Manager
- Display running configuration: show running-config
- Enter Configuration Mode: configure terminal
- Exit Configuration Mode: press Control-Z
- Save running configuration: write memory or copy running-config startup-config
- Display detailed Logs: show manager log reverse
- Display filesystem capacity: show filesystems
- Display running processes: show process monitor
- Enable Fail-Safe: https ://<NSX Manager IP FQDN>/api/2.1/failsafemode, REQUEST BODY: FAIL_OPEN (VM traffic is allowed if vShield Stateful Firewall is down) – UNVERIFIED
NSX Controller
- Display the Control Cluster state: show control-cluster status
- Display the nodes in the cluster: show control-cluster startup-nodes
- Display roles of an individual controller: show control-cluster roles
- Display network interfaces: show network interface
- Display default gateway: show network default-gateway
- Display DNS servers: show network dns-servers
- Display NTP servers: show network ntp-servers
- Display status of NTP servers: show network ntp-status
- Traceroute: traceroute <ip_address/name>
- Ping: ping <ip> or ping interface adder <ip>
- TCP Dump: watch network interface <int> traffic
- Verify switch manager and api-provider addresses: listen-ip
- Display Controller disk space: show status
- Display system statistics: show system statistics <RRD data source>
- Display system statistics as a graph: show system statistics graph <RRD data source>
- Compatibility check: request system compatibility-report
- Display the event history of the Control Cluster: show control-cluster history
- Display active cluster connections: show control-cluster connections
- Find the cluster majority leader: show control-cluster connections (search for “persistence_server server/2878 Y”)
- Forcibly resynchronise a faulty controller to the majority leader: join control-cluster <majority IP> force
- Display the control cluster core statistics: show control-cluster core stats
- Display active TCP connections: show network connections of-type tcp (can also specify udp unix)
- Deployed DLRs and ESGs: show control-cluster logical-routers instance all
- Detailed information about specific ESG/DLR: show control-cluster logical-routers interface-summary <LR-Id 0xA..n>
- Detailed information about specific ESG/DLR Interface: show control-cluster logical-routers interface <LR-Id 0xA..n> <Interface A..n>
- Display routes of DLR: show control-cluster logical-routers routes <LR-Id 0xA..n>
- Display Logical Switch details: show controller-cluster logical-switches vni <Segment ID aka VNI>
- Display Logical Switch connection table: show controller-cluster logical-switches connection-table <Segment ID aka VNI>
- Display Logical Switch VTEP table: show control-cluster logical-switches vtep-table <Segment ID aka VNI>
- Display Logical Switch MAC table: show control-cluster logical-swtiches mac-table <Segment ID aka VNI>
NSX Edge Services Gateway and DLR Control VM
- Display Complete Configuration: show configuration
- Display IP Routing table: show ip route
- Display OSPF entries in the IP Routing table: show ip route ospf
- Display BGP entries in the IP Routing table: show ip route bgp
- Display ISIS entries in the IP Routing table: show ip route isis
- Display BGP summary: show ip bgp
- Display BGP neighbours: show ip bgp neighors
- Display OSPF summary: show ip ospf
- Display OSPF neighbours: show ip ospf neighbor
- Display OSPF interfaces listening for neighbours: show ip ospf interface
- Display OSPF link state database: show ip ospf database
- Display OSPF link statistics: show ip ospf statistics
- Display ISIS summary: show isis
- Display ISIS neighbours: show isis neighbors
- Display ISIS interfaces listening for neighbours: show isis interface
- Display ISIS link state database: show isis database
- Display logs: show log reverse
- Debug OSPF – must view from Console: debug ip ospf (no debug ip ospf to disable)
- Debug BGP – must view from Console: debug ip bgp (no debug ip bgp to disable)
- Debug ISIS – must view from Console: debug isis (no debug isis to disable)
- Debug packets to SSH window: debug packet display int <vNIC> <Packet Filter> (no debug to disable) – NEW!
- Display Interfaces: show interface
- Display ARP table: show arp
- Display top N firewall flows: show firewall flows topN <number>
- Display all firewall flows: show firewall flows
- Get SSL-VPN Configuration: show configuration sslvpn-plus
- See if SSL-VPN is running: show service sslvpn-plus
- See SSL-VPN active user sessions: show service sslvpn-plus sessions
- See SSL-VPN active tunnels: show service sslvpn-plus tunnels
- SSL VPN log messages: “STATE_MAIN_I1” “s1-c1” “NO_PROPOSAL_CHOSEN” – problem with Phase 1 or Phase 2 negotiations
- SSL VPN log messages: “INVALID_ID_INFORMATION” – Pre-Shared Key Mismatch “Quick Mode” – UNVERIFIED
- Display LB summary: show service loadbalancer
- Display LB errors: show service loadbalancer error
- Display LB monitor: show service loadbalancer monitor
- Display LB Configuration: show configuration loadbalancer
- Display LB virtual server status: show service loadbalancer virtual <virtual server name>
- Display LB server pool status: show service loadbalancer pool <pool name>
- Display LB active sessions: show service loadbalancer session
- Display LB sticky mapping table: show service loadbalancer table
- Display DHCP status: show service dhcp
- Display DHCP lease information: show service dhcp leaseinfo
- Clear all DHCP leases: clear service dhcp lease (privileged mode)
- Display DNS service status: show service dns
- Display the DNS cache: show service dns cache
- Clear the DNS Cache: clear service dns cache (privileged mode)
- Display Network Address Translation: show nat
ESXi Host
- Ping a VTEP: ping ++netstack=vxlan –d –s 1572 –I vmk3 <VTEP IP>
- Display VXLAN Inner/Outer MAC and Outer IP information for a VXLAN: esxcli network vswitch dvs vmware vxlan network mac –vds-name <VDS> –vxlan-id <Segment ID aka VNI>
- Display VXLAN list: esxcli network vswitch dvs vmware vxlan network list
- Display VXLAN detailed information: esxcli network vswitch dvs vmware vxlan network list –vds-name <VDS> –vxlan-id <Segment ID aka VNI>
- Display VXLAN MAC list: esxcli network vswitch dvs vmware vxlan network mac list –vds-name <VDS> –vxlan-id <Segment ID aka VNI>
- Display VXLAN ARP list: esxcli network vswitch dvs vmware vxlan network arp list –vds-name <VDS> –vxlan-id <Segment ID aka VNI>
- Display VXLAN VTEP list: esxcli network vswitch dvs vmware vxlan network vtep list –vds-name <VDS> –vxlan-id <Segment ID aka VNI>
- Display VXLAN Port list: esxcli network vswitch dvs vmware vxlan network port list –vds-name <VDS> –vxlan-id <Segment ID aka VNI>
- Display pNIC list: esxcli network nic list
- Display pNIC details: esxcli network nic get -n <vmnicN>
- Display TCP Segmentation Offload (TSO) status: esxcli network nic tso get -n <vmnicN>
- Display Checksum Segmentation Offload (CSO) status: esxcli network nic cso get -n <vmnicN>
- Shutdown pNIC: esxcli network nic down -n <vmnicN> (handy for isolating a LAG to one pNIC)
- Enable pNIC: esxcli network nic up -n <vmnicN>
- Display all VMkernels: esxcfg-vmknic -l
- Display all VMs on a VDS related to DVPort ID: esxcfg-vswitch -l
- Display all VMkernel neighbour ARP table: esxcli network ip neighbor list
- Display controller status: net-vdl2 -l
- Check ESXi netcpa-worker is connecting to Controller on port 1234: esxcli network ip connection list | grep tcp | grep 1234 (look for ESTABLISHED, SYN_SENT indicates an issue)
- Display Distributed Router instances: net-vdr –instance -l
- Display Distributed Router instance LIF information: net-vdr –lif –l <name>
- Display Distributed Router instance route information: net-vdr –route –l <name>
- Display Distributed Router instance bridge information: net-vdr –bridge –l <name>
- Display Distributed Router instance MAC address table information: net-vdr –mac-address-table –b <name>
- Display Distributed Router instance MAC address information: net-vdr –mac -b <name>
- Get UUID of a specific VM: summarize-dvfilter | grep <VM name>
- Find filter name for a specific VM UUID: vsipioctl getfilters
- Look up rules for that filter name: vsipioctl getrules –f <filter name>
- Look up address lists for that filter name: vsipioctl getaddrsets –f <filter name>
- Packet traces that can be imported into Wireshark: pktcap-uw -A (option list)
- Installation status of NSX VIBs: esxcli software vib remove –vibname esx-vxlan or esx-vsip or esx-dvfilter-switch-security
- Manually remove NSX VIBs: esxcli software vib get –vibname esx-vxlan or esx-vsip or esx-dvfilter-switch-security
- Verify NSX User World Agent (UWA) status: /etc/init.d/netcpad status
- Verify netcpa daemon is running: esxtop (look for netcpa.nnnn process, press q to quit)
- Verify Message-bus service is running: /etc/init.d/vShield-Stateful-Firewall status
- Verify vShield-Stateful-Firewall process is running: ps | grep vsfwd
- Verify active Message Bus TCP connections: esxcli network ip connection list | grep 5671
- Verify Rabbit MQ variables (total 16): esxcfg-advcfg –l | grep Rmq
- Verify the Rabbit MQ address is that of NSX Manager: esxcfg-advcfg -g /UserVars/RmqIpAddress
- Verify that the Kernel modules were loaded to memory: vmkload_mod –l | grep vsip
Additional Resources
- NSX Link-O-Rama
- VMware Education will be releasing their VMware NSX Troubleshooting and Operations course soon
- NSX vSphere Troubleshooting by Sebastien Braun
- The (Un)Official VMware VCIX-NV Study Guide by LostDomain.org
- Troubleshooting NSX-V Controller by Roie Ben Haim
- NSX-v Troubleshooting L2 Connectivity by Roie Ben Haim
- NSX Distributed Firewall Deep Dive by Roie Ben Haim
- NSX-v Troubleshooting Links by Roie Ben Haim
- NSX Compendium by Network Inferno
- Some useful NSX Troubleshooting Tips by Cormac Hogan
